Defining A Gaussian Sensor Frequency Response Example
This example shows how to account for the frequency response of detectors when this response has a Gaussian shape (for example, piezoelectric ultrasound transducers). It builds on the Homogeneous Propagation Medium Example.
Contents
Defining the sensor frequency response
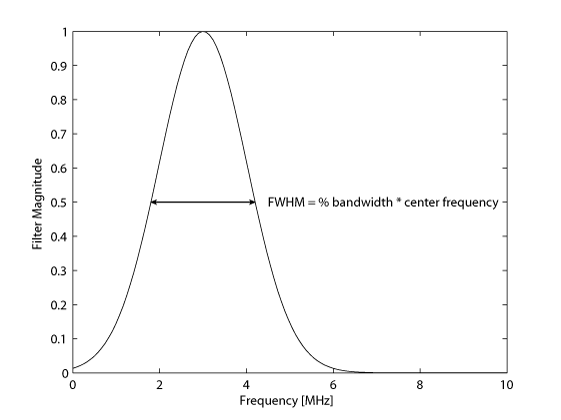
The frequency response of the sensor is assigned using the frequency_response field of the sensor input structure. This accepts two parameters, one for the center frequency, and one for the bandwidth of the frequency response. The transducer bandwidth, defined as a percentage, controls the full-width at half-maximum (FWHM) of the filter, where the FWHM = % bandwidth * center frequency.
% define the frequency response of the sensor elements
center_freq = 3e6;      % [Hz]
bandwidth = 80;         % [%]
sensor.frequency_response = [center_freq, bandwidth];
When an input for sensor.frequency_response is defined, a Gaussian filter is applied within the simulation functions after the simulation is completed by multiplying the Fourier transformed signals by a zero-phase Gaussian window using gaussianFilter. Note, the same filter can also easily be applied by calling gaussianFilter explicitly when the sensor data is returned.
Running the simulation
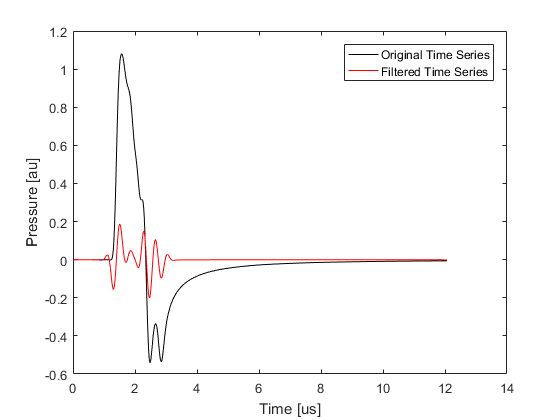
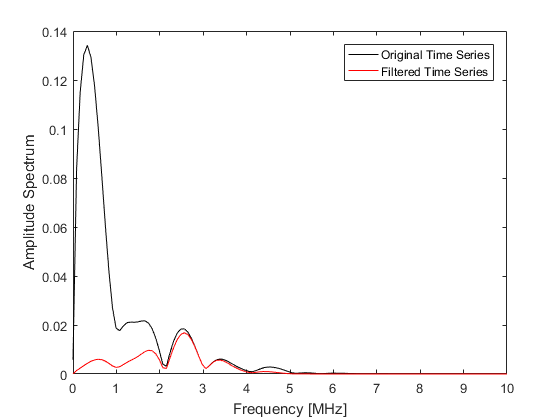
To illustrate the effect of the filter, the time series recorded at the first sensor position for a simulation with and without the sensor.frequency_response field defined are plotted below. The corresponding amplitude spectrums are also shown. The removal of the low frequency information has a significant effect on the signal amplitude.